instrument-related uncertainty analysis for custom laser focus measurement microscope
· research
previously i built my own automated microscope for imaging laser focus measurement artifacts. naturally as the guy who is claiming that the system i built can measure these things, my main concern is making sure my claims actually hold water. a measurement without an uncertainty statement is just a number. so this work is about pulling apart the instrument-related sources of uncertainty in the focal offset measurement system and putting real values on them.
as a quick recap, the system works by placing anodized aluminum artifacts in the build chamber and ablating tracks at known z-offsets. from the track widths, you fit the beam caustic
\[ \omega = \omega_0 \sqrt{1 + \frac{z_{\text{off}}^2}{z_R^2}} \]to extract the focal offset \(z_0\) at each measurement location. the minimum of that curve tells you where the laser is actually focused relative to the build plane.
what can go wrong
the measurement chain has three broad categories of uncertainty contributors: stuff related to the substrate (anodized coating consistency, machining tolerance), stuff related to the AM machine (z-stage positioning repeatability, power stability), and stuff related to the microscopy instrument itself. this is summarized in the fishbone diagram below.
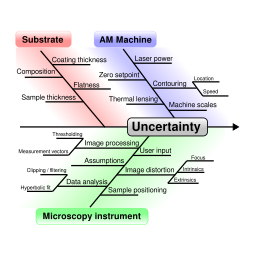
for this study I focused specifically on the instrument-related contributors, treating the microscopy system as a closed black box. the internal processing parameters (thresholding, filtering, image distortion) are set aside for now; the question is just: given the same physical sample, how much does the output number move when you wiggle the instrument's input conditions? machine z-stage repeatability is also excluded because EOS doesn't publish their scale data and properly characterizing it would be its own project.
the setup
all measurements were taken on a single point on a single artifact, located about 93 mm from the center of the build area on the EOS M400 at oerlikon. the idea was to isolate per-point behavior by holding everything else constant. the artifacts were machined to 2.65 mm thickness and anodized with a black type II coating per MIL-A-8625, with offset steps from -5 mm to +5 mm at 1 mm intervals.
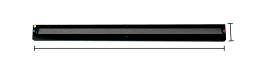
the automated system was set to repeatedly image one section of the artifact without moving, capturing up to 999 images at programmed intervals. for each image it logs the track width averages, standard deviations, and calculated focal offset. six contributors were evaluated: long-term stability, temperature fluctuation, flash brightness, microscope focus, equation fit sampling bias, and sample thickness variation.
repeatability and temperature
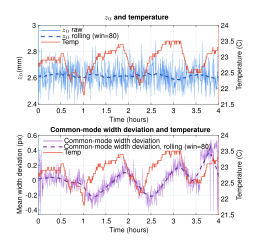
the first test was a 4-hour stability run: one measurement every 15 seconds, 999 total, while logging ambient temperature with a DHT11 sensor taped to the enclosure.
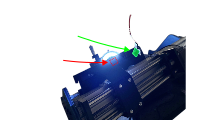
the result was that the reported focal offset value didn't change in any meaningful way over the 4 hours, even as the room temperature drifted. what did change was the raw track widths, shown below. as temperature increased, the widths shifted, with about a 30-minute lag.
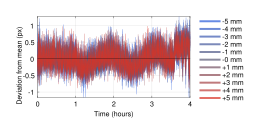
but here's the thing: since the focal offset calculation is fundamentally a relative measurement (fitting a curve shape, not reading absolute widths), a common-mode shift in all track widths doesn't move the minimum of the caustic fit. the method is inherently self-correcting against thermal drift. so temperature was dropped as an uncertainty contributor.
flash brightness
to test sensitivity to illumination, I ran another 999-image capture while slowly ramping the ring flash from fully dim to fully bright. the camera was set to auto-exposure to prevent over/underexposure.
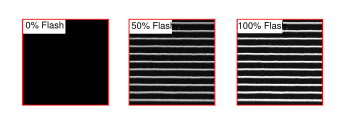
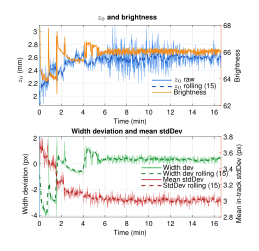
the auto-exposure correction largely held things stable above about 30% flash brightness. there was some variation in \(z_0\) between 30% and 60%, but the common-mode width deviation and its standard deviation didn't noticeably change from 30% onward. since flash brightness above 30% produced no statistically significant change, this contributor was also dropped from the uncertainty budget.
camera focus
this is the one that actually matters. i approximated a focused position by eye, then stepped the camera position from -10 μm to +10 μm in 1 μm increments, capturing images at each step. image sharpness was quantified using the variance of the discrete laplacian: \(L(r,c) = I(r-1,c) + I(r+1,c) + I(r,c-1) + I(r,c+1) - 4I(r,c)\), evaluated on a subsampled grid (every 8th pixel) for speed.
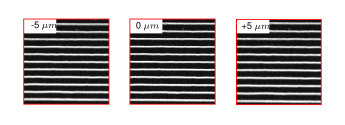
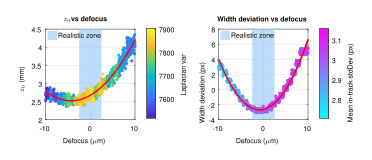
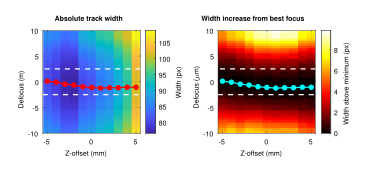
the interesting finding was that even within the visually in-focus region, \(z_0\) correlated with camera position. this is despite the common-mode track width deviation centering around zero, meaning tracks widen roughly equally in both defocus directions. the effect on individual tracks is more dramatic outside the realistic focus zone:
inside the realistic ±2.5 μm zone, a linear fit to the \(z_0\) vs camera position data yielded a sensitivity of 0.07 mm/μm with an \(R^2\) of 0.62, a semi-strong positive correlation.
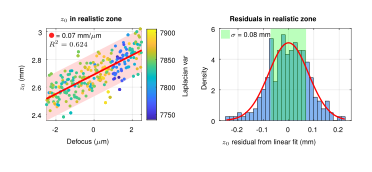
assuming an operator could land anywhere in that ±2.5 μm window with equal probability (rectangular distribution), the uncertainty in camera position is \(u_{\text{cam}} = 2.5/\sqrt{3} = 1.44\) μm. multiplied by the sensitivity, the uncertainty contribution from camera focus is \(u_{\text{foc}} = 0.07 \times 1.44 = 0.101\) mm. this turned out to be the largest single contributor.
equation fit sampling bias
this one is more subtle. because the sampling range is fixed (-5 mm to +5 mm) but the true focal offset isn't centered at zero, the data points end up being asymmetric around the true minimum. if the real offset is at +3 mm, you have way more data on the negative side of the curve than the positive side. that asymmetry can pull the fitted minimum.
to characterize this, I ran 8000 monte carlo simulations at sweeping theoretical offsets. each simulation perturbed points around a theoretical caustic (\(z_R = 14\) mm, \(d_0 = 80\) μm) with gaussian noise (\(\sigma = 3\) px) and re-fit the curve.
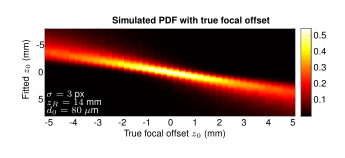
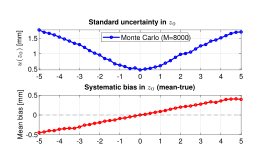
at the measured offset of ~2.6 mm, the simulation predicts about 0.25 mm of bias and ~1 mm of added standard uncertainty. without a traceable reference to confirm the bias, this correction is noted but not applied. it's a known systematic issue that could be addressed in the future by either extending the sampling range or having a reference measurement to calibrate against.
sample thickness
sample thickness is a direct offset contributor: if the artifact is thicker or thinner than the programmed value, the whole z-offset scale shifts. nominal thickness was 2.65 mm. measuring across the sample with calipers (0.01 mm resolution) showed no detectable variation. treating this as a rectangular distribution: \(u_{\text{cal}} = 0.005/\sqrt{3} = 0.003\) mm. negligible.
combined result
the 999-measurement stability study gave a mean \(z_0\) of 2.613 mm with a standard deviation of 0.079 mm. that standard deviation serves as the type A repeatability uncertainty \(u_{\text{rep}}\).
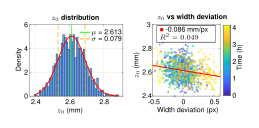
combining everything per GUM methodology:
\[ u_c = \sqrt{u_{\text{rep}}^2 + u_{\text{foc}}^2 + u_{\text{cal}}^2} = \sqrt{0.079^2 + 0.101^2 + 0.003^2} = 0.128 \text{ mm} \]for a single measurement (which is the practical use case), the expanded uncertainty is ±0.256 mm at \(k = 2\). the dominant contributor is camera focus, which is kind of annoying because it means the biggest source of uncertainty is an operator squinting at a screen and deciding when the image looks sharp enough. an auto-focusing routine would cut that contributor way down and is high on the list for the next iteration.
the bigger limitation is the lack of a traceable reference. without a machine whose focal offset has been independently measured, there's no way to separate true measurement error from the numbers. future work will involve measuring a system with a traceably characterized laser focus to close that loop and actually determine how accurate the system is instead of just how repeatable.